They say that the table never lies in football, but if you don’t know what the table is saying then you won’t be able to understand the truths captured within it. As you are probably aware, each team plays a set number of games in a season – in the English Premier League, for example, that is currently 38 games per side. They get three points for a win, one for a draw and nothing for a defeat.
The league table depicts this information, with the teams ranked in order of the number of points that they have. But there’s so much more detail to be learned from the table that it’s worth reminding ourselves of the different abbreviations to be found at the top of each column.

bet365 6 SCORES CHALLENGE
Predict scores to win cash prizes!
Win cash prizes by predicting the scores of just six Soccer matches, with 6 Scores Challenge at bet365! All is not lost if you fall short on one or two results, prizes are on offer for three, four and five correct results.
The prize value displayed for six correct predictions is the maximum available based on a single winner in that round and will be reduced in the event of a shared prize-pool.
How to Read a League Table
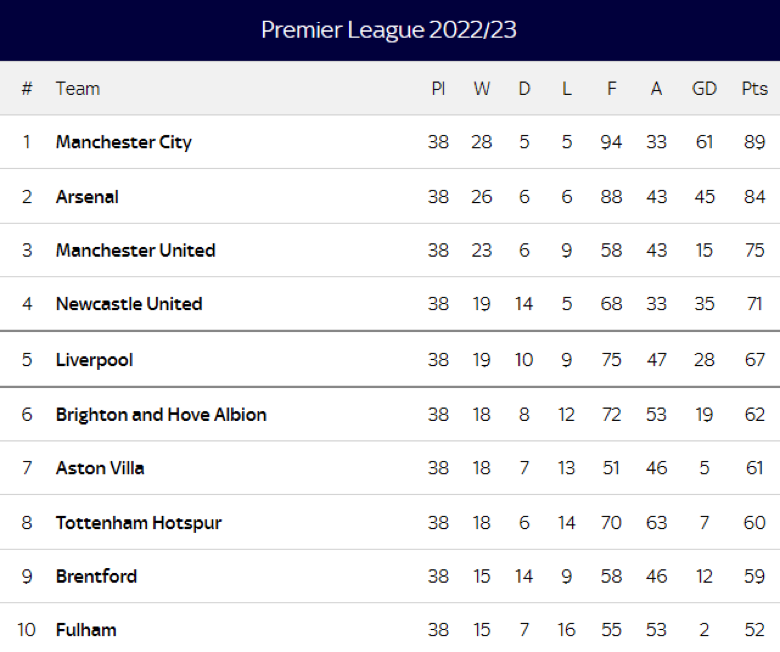
We’ve taken a screenshot below from the Sky Sports website, which shows the top half of the 2022/23 Premier League table with all the various abbreviations shown:

Starting from the extreme left, the number to the left of the team’s name shows their position in the league table. These are ordered by the number of points won, or by goal difference when the points tallies of two or more teams are level.
PL/MP: Number of Games
The team names are self-explanatory, before we move onto the abbreviations: PL in this example – or MP as it’s shown elsewhere – refers to the number of games that team has played. For the most part, you’d expect all clubs to have played the same number of games, but postponements, abandonments and the re-arrangement of fixtures (perhaps after a clash with a cup game) can lead to clubs having played a different number to their rivals.
WDL: Win, Draw, Loss
The W, D and L refer to the three possible results available in league football: win, draw or loss. As you can see in our example screenshot, Manchester City won 28 of their 38 games, drew five and lost five on their journey to the 2022/23 Premier League title.
F/GF: For/Goals For
Next up we have F, or GF as you may see it displayed elsewhere. This stands for For or Goals For, and is therefore self-explanatory – City blitzed 94 goals in the table above. While we’re on the subject, we can move on to the next column: A or GA. This is Against or Goals Against, revealing how many goals a team has conceded.
GD: Goal Difference
The next column is GD, or Goal Difference. This is the result of taking Goals Against from Goals For; so, the GD tally for each team can be a positive or negative number depending upon their performances on the pitch.
PTS: Points
Finally, we have the PTS column. This shows how many points each team has generated. You can multiply the win column by three while the draw column is as it reads (there’s one point per draw). Add the two together to get the total points haul – Man City’s return of 89 points came from 28 wins (28 x 3 = 84), plus five draws (5 x 1 = 5).
How to Read an Extended League Table
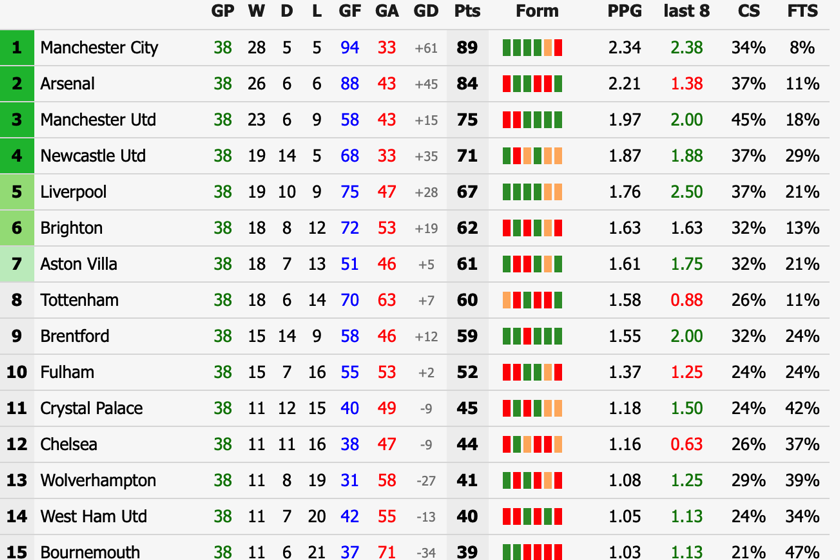
For the most part, the simple league table above will be more than enough for you to get the information you’re looking for. But if you do want a little more detail, there’s extended or ‘wide’ tables that display additional stats that might be of interest – like this one from SoccerSTATS:

The left-side of the table is the same as we’ve described above, so that should be familiar. But as we move to the right, new details emerge.
PPG: Points Per Game
PPG stands for Points Per Game, which is quite simply the calculation of points earned divided by the number of games played.
Other
And then we have the home and away splits: WH is the home win column, DH is the home draw and LH is the home loss tally, while GFH and GAH are the goals scored and conceded in home matches. The away tallies are represented by WA, DA and so on.
What Do the Lines Mean on a League Table?
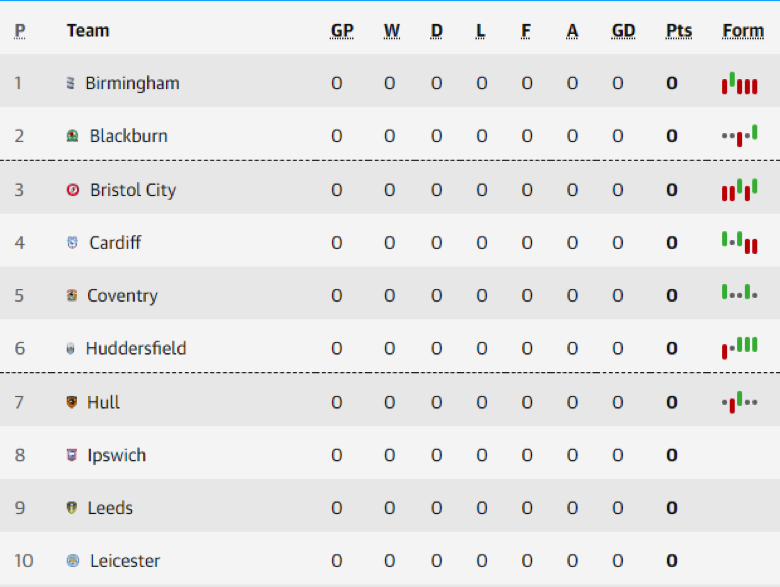
There’s one another detail on a football league table that can confuse some fans. Take a look at the screenshot below. This is the Championship league table, and you can see dotted lines separating second and third place, as well as sixth and seventh:

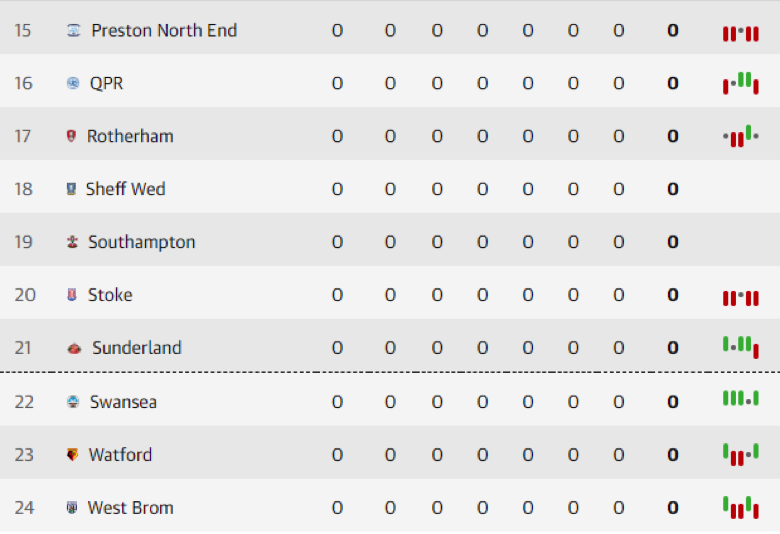
This details the race for promotion. The top two teams gain automatic promotion, which is why the line is there, while the sides finishing third, fourth, fifth and sixth secure a place in the play-offs. For those below the line – i.e. seventh and below – it’s a case of close but no cigar. Now here’s the bottom part of the league table:

Quite simply, the teams finishing 22nd, 23rd and 24th here are relegated to the tier below (League One in this case). The teams that finish above that dotted line are safe from demotion.

